UK NHS Primary Care Networks December 2025 for England in Vector Editable File Formats and KML or Shapefiles
UK NHS Primary Care Networks December 2025 for England in Vector Editable File Formats and KML or Shapefiles
In the NHS, Primary Care Networks (PCNs) are groups of GP practices that work together to provide coordinated and integrated healthcare services to their local communities. PCNs are designed to help improve the quality and accessibility of primary care, and to support the delivery of wider healthcare services. PCNs are organized based on geographical boundaries, typically covering a population of 30,000 to 50,000 people. The boundaries of PCNs are determined by the local Clinical Commissioning Groups (CCGs), which are responsible for planning and commissioning healthcare services in their areas. PCNs provide a range of services, including extended hours access to primary care, social prescribing, and support for patients with long-term conditions. They also work closely with other healthcare providers, such as community services and hospitals, to ensure that patients receive the most appropriate care and support.
Our Primary Care Networks boundary maps come as vector editable files which can be opened in Adobe Illustrator, inkscape or PowerPoint. You also receive svg images which can be imported into office documents and even linked to in Excel(ONLY if you have expertise in this area).

This is just a vector snapshot of part of the whole UK ICB map. It shows the ICB boundaries of London. It's an svg image so no matter what level of zoom or scale it is printed, it will not lose any resolution.
We've created a small bundle of files available to download completely free of charge below.
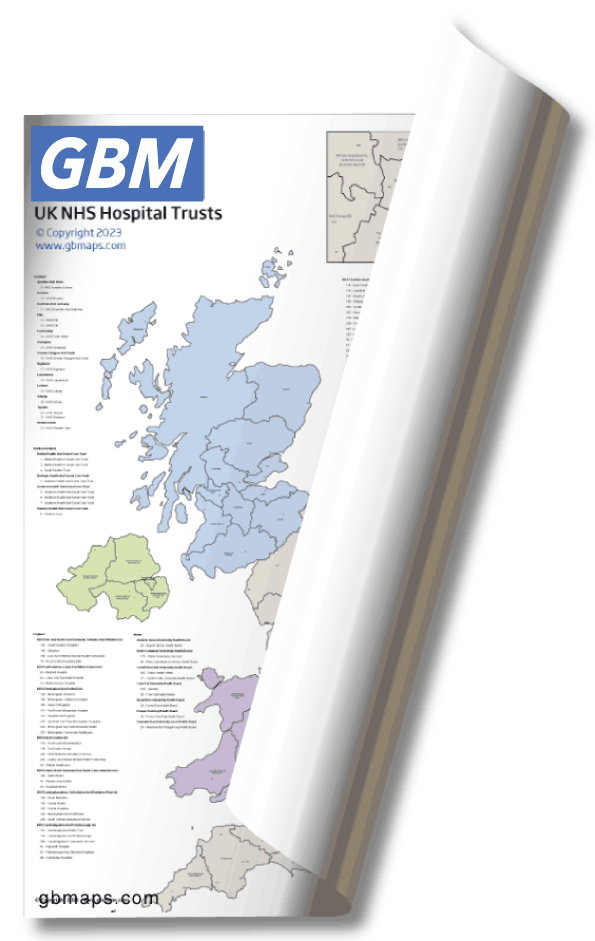
GIS Files Sample DownloadOur large glossy laminated maps of the NHS ICB boundaries offer an invaluable tool for healthcare professionals, researchers, and policy makers. With accurate and up-to-date information, these maps enable you to visualize the complex structure of the NHS and make informed decisions based on the latest data. The laminated finish ensures durability and easy cleaning, making it a reliable reference tool that will last for years to come. Whether you're looking to improve patient care, optimize resource allocation, or analyze healthcare trends, our maps provide a clear and comprehensive view of the NHS landscape, helping you navigate the complexities of the system with confidence.

| Size | Laminated | |
| A2 | £35.00 | |
| A1 | £46.00 | |
| A0 | £62.00 | |
| Size | Non-Laminated | |
| A2 | £22.00 | |
| A1 | £30.00 | |
| A0 | £44.00 | |
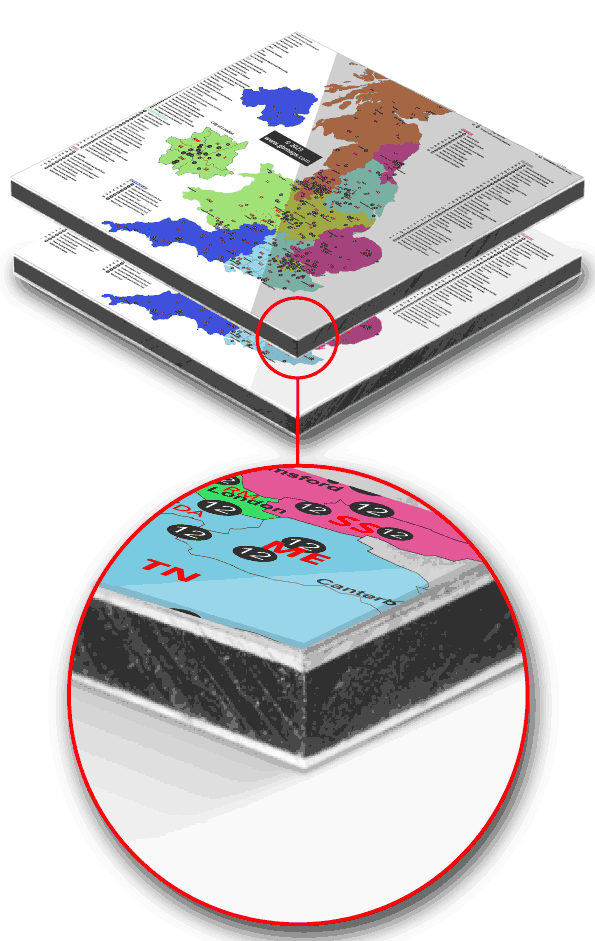
For those looking for an even more permanent solution, we also offer the option to print these maps onto a rigid dibond. This creates a sturdy, long-lasting surface that can withstand heavy use and remain free from warping, even in challenging environments. Dibond printing is perfect for situations where your map will be subject to frequent handling or extreme temperatures, and it's an ideal choice for healthcare facilities, research labs, and other high-traffic settings. With the added durability of a dibond backing, you can rest assured that your map will remain legible and accurate for many years to come, no matter where it's used.

| Size | Cost | |
| 120 cm x 240 cm | £274.00 | |
| 80 cm x 120 cm (A0) | £148.00 | |
| 60 cm x 40 cm | £66.00 | |
| 80 cm x 60 cm | £82.50 | |
| 50 cm x 50 cm | £74.80 |
All the above can be contour cut to any shape required.
Here's a little bit of drivel about our disclaimer
While we strive to ensure the accuracy and quality of our maps, we understand that mistakes can happen. We want to assure you that if any errors are found in our digital maps, we will make every effort to rectify the issue as soon as possible. However, once the maps have been printed, we cannot accept any liability for any inaccuracies or omissions, and we are unable to offer refunds or replacements for printed maps. We advise that you verify the information on our maps with other sources to ensure that you have the most up-to-date and accurate data. By using our maps, you acknowledge and agree that we shall not be liable for any errors or inaccuracies, and you assume full responsibility for any decisions or actions you take based on the information provided.
Get more than just a map with our NHS Primary Care Networks digital files bundles. We can provide an accompanying Excel spreadsheet that contains detailed information about the Primary Care Networks in the UK. This data is sourced and compiled from numerous(recent) publicly available sources. You can use this information to gain valuable insights into healthcare trends, resource allocation, and patient outcomes, and make informed decisions that improve the overall quality of care. Our Excel spreadsheet is easy to use and is designed to be a valuable tool for healthcare professionals, researchers, and policy makers. If purchased along with our NHS Primary Care Networks digital files bundles, you'll have all the information you need to make data-driven decisions that improve patient outcomes and enhance the overall quality of care.
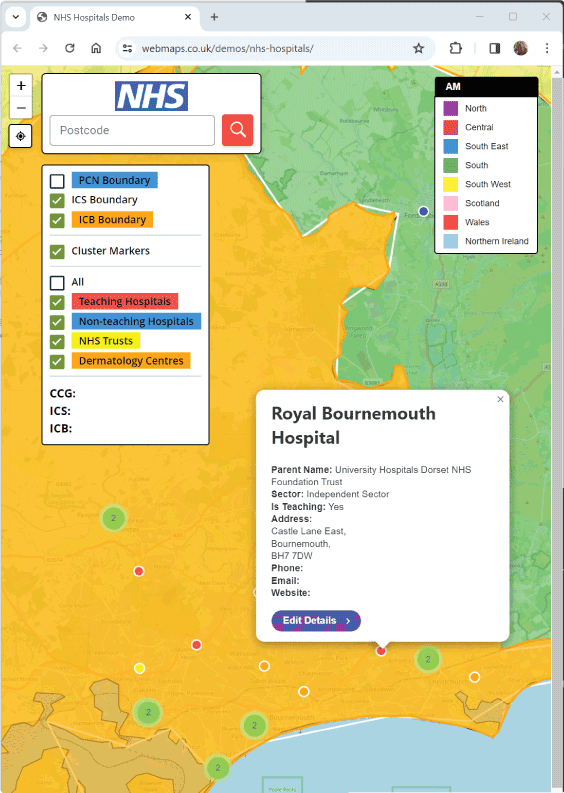
This is a simple screenshot of one of our online NHS web mapping applications. We build them at a fraction of the cost of other developers.
Our web-based mapping app development services provide a powerful tool for visualizing and analysing healthcare data. Get in touch to find out more.
Our PCN (Primary Care Network) map offers an intricate and detailed visualization of healthcare provider locations across England. This map represents the culmination of advanced geographic and data processing techniques, providing a unique perspective on the distribution and network of healthcare services within each PCN.
The journey of creating this map began with an extensive collection of over 50,000 data points. These points represent a wide array of healthcare providers, including doctors, chemists, and other medical services, each integral to their respective Primary Care Networks (PCNs) across England. This initial step was crucial in laying the groundwork for a comprehensive and accurate representation of healthcare coverage.
Our next step involved the meticulous grouping of these data points based on their PCN affiliations. This process was not just about clustering data; it was about capturing the essence of each PCN's reach and influence across the geographic landscape of England. By grouping the data in this way, we could ensure that each network was distinctly and accurately represented.
To visualize the geographical scope of each PCN, we employed a convex hull algorithm. This sophisticated algorithm allowed us to create polygonal boundaries around the grouped points of each network. These polygons are not arbitrary shapes but carefully calculated to envelop all points of a specific PCN, effectively highlighting the geographical boundary of each network's coverage.
With the polygons defined, our next task was to extract the centroid - the geometric center - from each polygon. These centroids are pivotal in our map-making process, serving as the foundation for the subsequent Voronoi diagram creation. Using these centroids, we applied the Voronoi method to generate distinct polygons for each PCN. This step was instrumental in delineating the unique area of influence and coverage for each network, providing a clear and intuitive visualization of how healthcare services are distributed across England.
Incorporating geographical accuracy, we refined our map by clipping the Voronoi diagram against a precise outline of England's coastline. This crucial step ensured that our map was not just data-accurate but also geographically precise, reflecting the true boundaries and contours of the country.
To enhance the map's usability and interpretability, each polygon was meticulously labeled with unique numbers. These labels are directly linked to a comprehensive list of full PCN names displayed alongside the map. This feature allows users to easily identify and correlate the visual polygons with the corresponding PCN names, making the map a practical tool for both professionals and the public.
The PCN Polygon Map of England is a testament to the power of combining vast data sets with advanced mapping techniques. It stands as an invaluable resource for understanding the landscape of healthcare provision across England, reflecting our commitment to innovative, data-driven solutions in healthcare analysis and visualization.
Call or message us today to talk about your project. Tel 01751 473136 or Contact Form